Week 1: RKHS Kernel Implementation
My first long term goal is to improve the existing conditional probability calculation module by making use of RKHS mapping to get rid of the curse of dimensionality problem that has been haunting the traditional method. Here is a day-wise summary of my progress throughout the week:
Monday:
My Internship officially started on this day, I had a 1 on 1 meeting with Roger Sir regarding this week’s assignment which would be to implement an RKHS kernel for the purpose of predicting a probability distribution function, given just a set of data points ( 1000 in my case) belonging to the said distribution. This would bolster my understanding of RKHS working and will come in use when implementing more complex kernels in the future.
Tuesday:
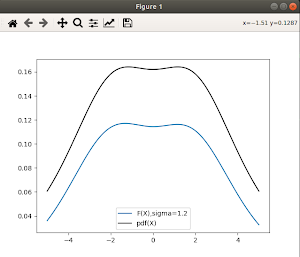
Implemented the RKHS kernel and the evaluation function. Dataset for the arbitrary function X = logistic(-2,1) if choice([0,1]) else logistic(2,1) was created using the synthDataGen.py script and used as the basis for the evaluation function. Made a simplistic plotting function just to see how it turned out. Received valuable advice from Roger Sir, specifically on how to improve the plotting function by limiting it to a shorter range and increasing the point density.
Wednesday:
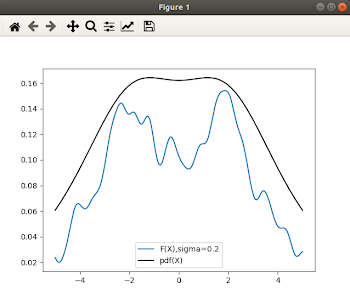
Created the ideal probability density function for the distribution we based our dataset on. This serves as the standard we wish to achieve with our RKHS implementation. After improvements to the plotting function, it allowed us to properly compare the curves derived from our evaluation function vs the ideal pdf() function for different values of sigma. However the graphs are not quite aligning due to a bug.
Thursday:
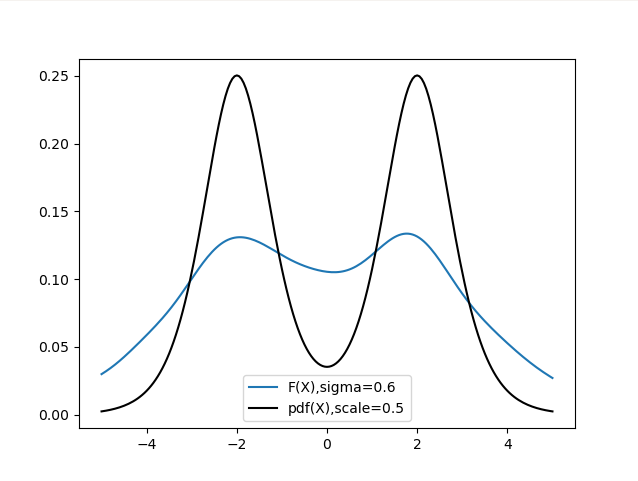
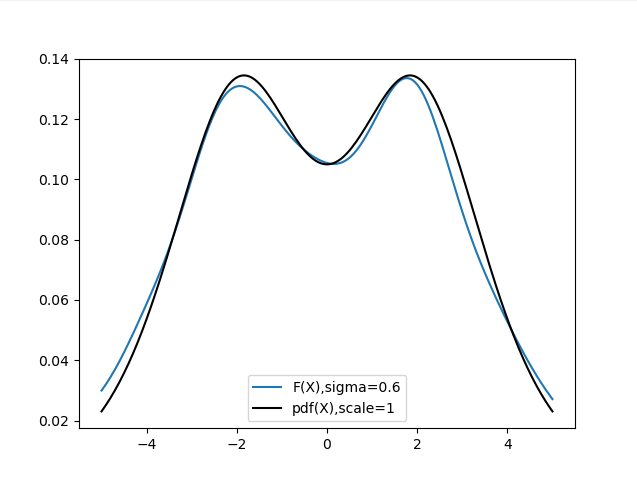
Fixed the bug in the pdf() function and finetuned the plotting function to now accommodate varying the scale parameter of the pdf() function to test results. Turns out, the sigma of our RKHS and scale of the pdf() function are quite similar, the smaller their value, the sharper the resulting curve is and vice versa. After experimenting for a while, I was able to observe a near perfect overlap at values sigma = 0.6 and scale = 1.
Comments
Post a Comment